01Define
Goals & measurement
We align on outcomes, KPIs, and data sources—so every report answers a business question, not just a vanity metric.

Data analysis services
From collection and cleansing to dashboards and forecasting—we connect your marketing, sales, and product data so leadership sees what matters, when it matters.
14 wks
To first executive-ready dashboard
0+
Source types we commonly unify
0%
Documentation & handover included


Prefer to browse first? View case studies
How we work
A structured analytics engagement—whether you need a one-time deep dive or an ongoing reporting rhythm.
We align on outcomes, KPIs, and data sources—so every report answers a business question, not just a vanity metric.
Tracking, pipelines, and validation: we make sure events, CRM, and ads data land reliably and stay comparable over time.
Clean joins, segments, and dashboards—executive summaries plus drill-downs so teams can self-serve without breaking the logic.
Rhythmic reporting, anomaly alerts, and recommendations—so insights turn into experiments, budget shifts, and better ROI.
0 wks
Typical path to first executive dashboard
0+
Source types we commonly unify (ads, CRM, product, web)
0%
Documentation & handover so your team owns the metrics
Analytics case studies
Tableau storytelling, executive KPI views, and a reproducible ecommerce pipeline—each with a Medium article or Tableau Public trail where we documented the work.
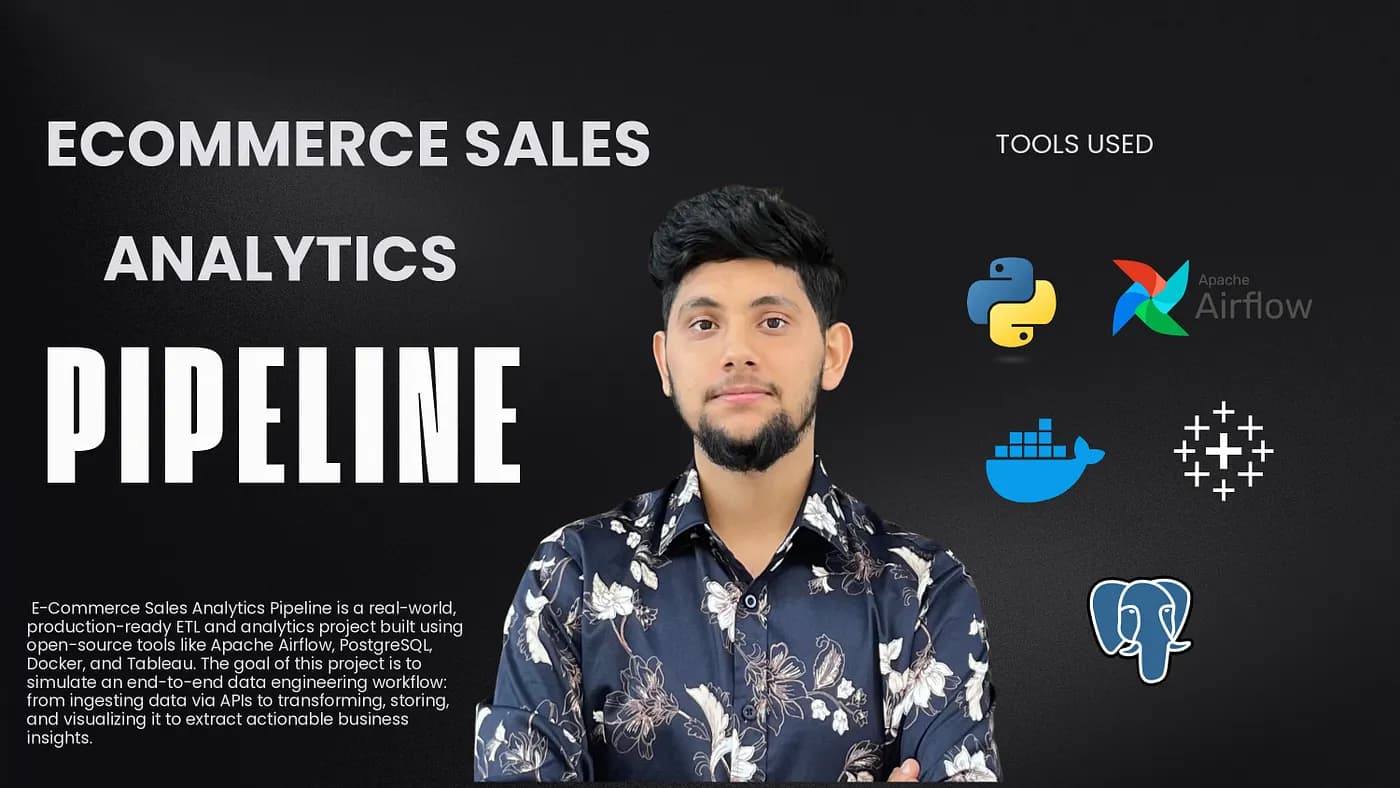
E‑commerce / Data engineering
A production-style pipeline that ingests e‑commerce API data on a schedule, lands it in PostgreSQL, and powers Tableau dashboards for sales, carts, and engagement.
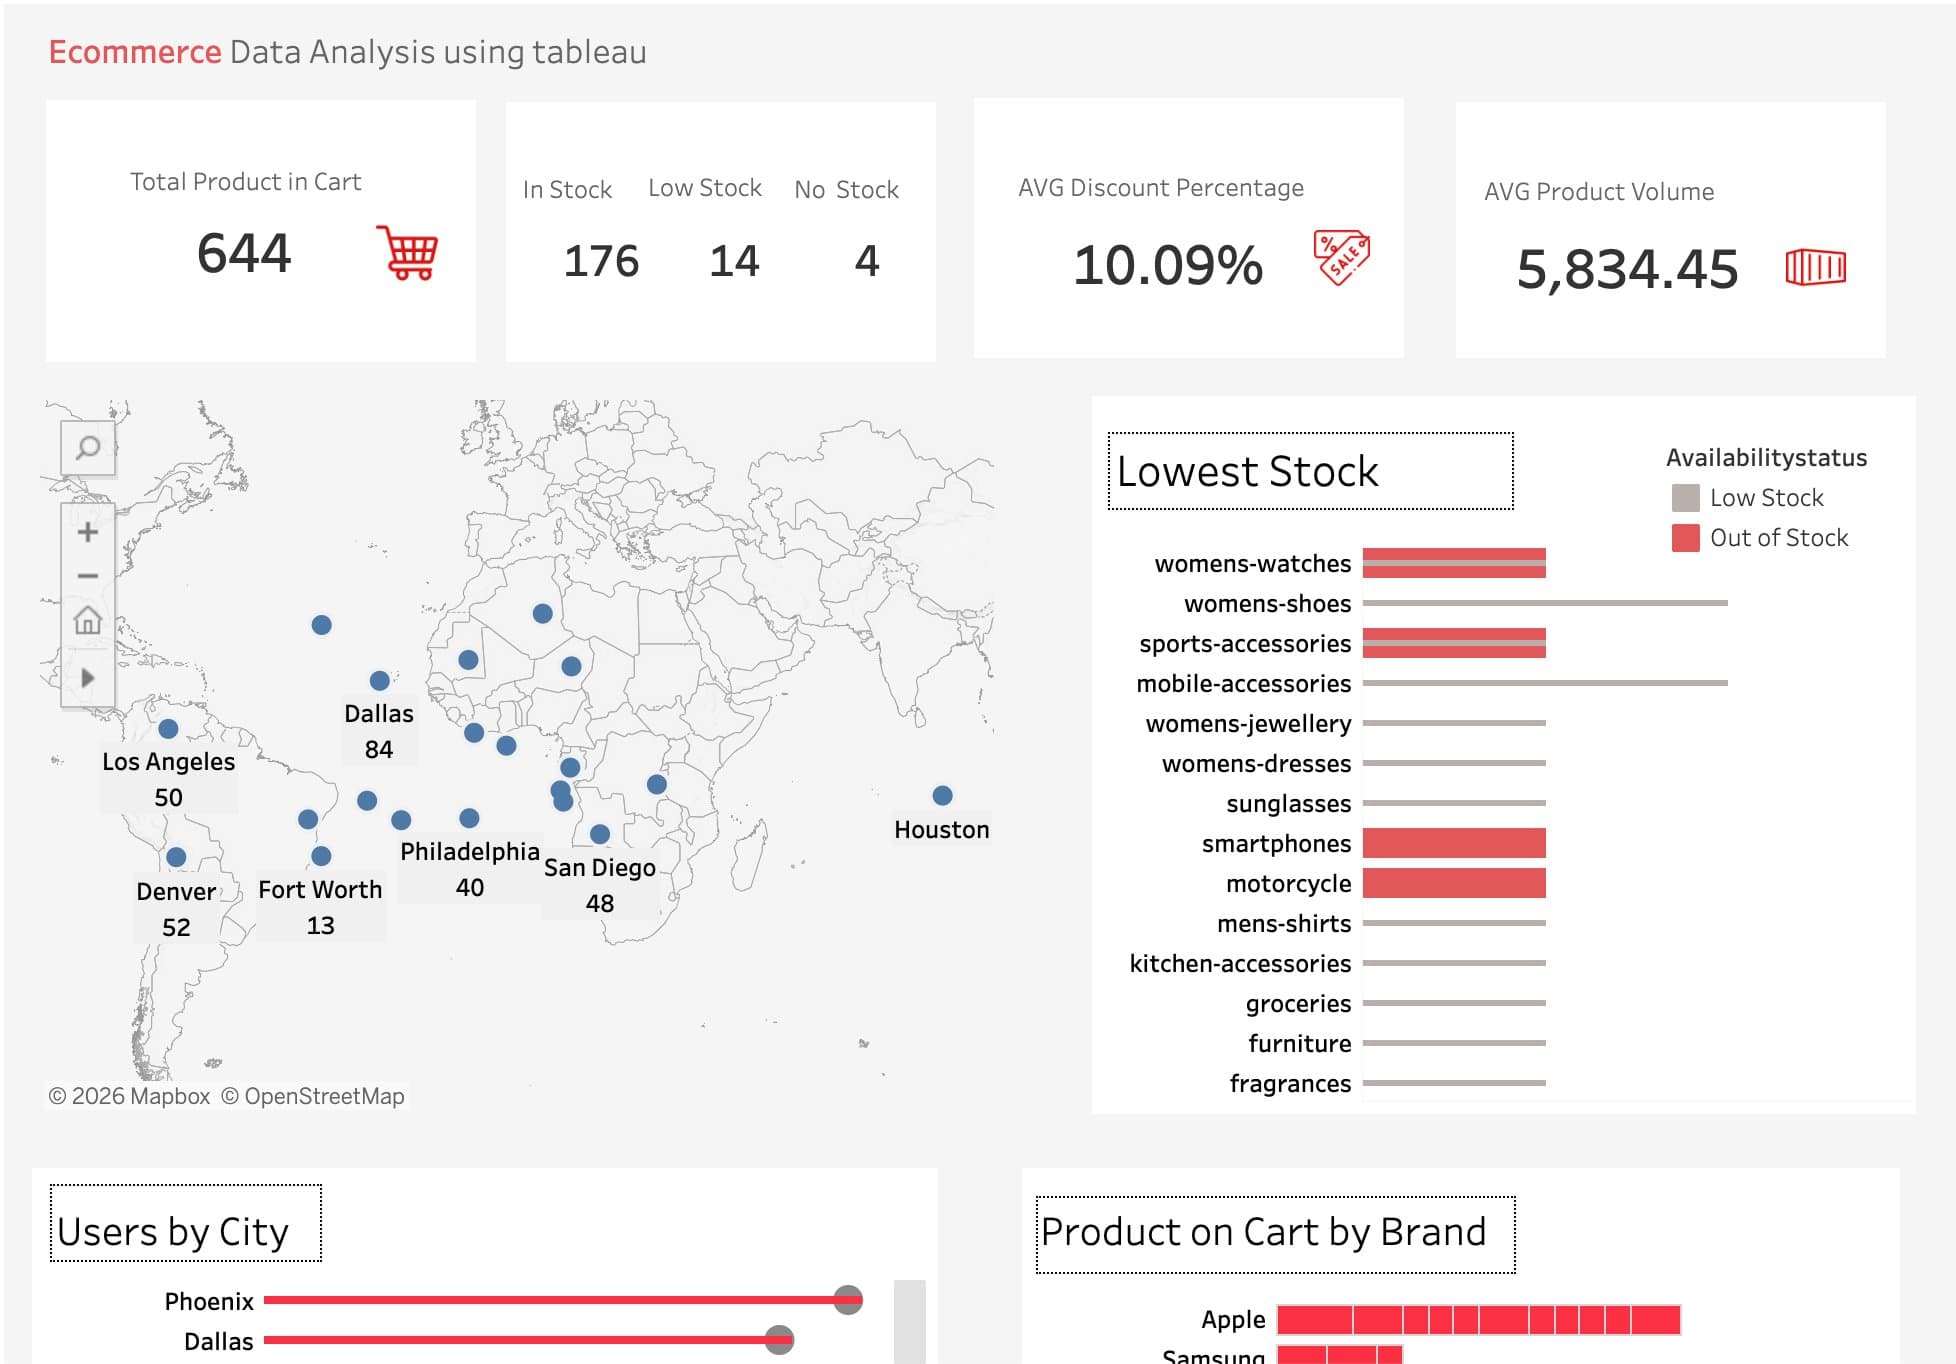
Retail / Inventory
A Tableau workbook that tracks hundreds of cart line items, stock risk, US city-level demand, and brand mix (for example Apple vs Samsung) so merchandising can see shortages early.
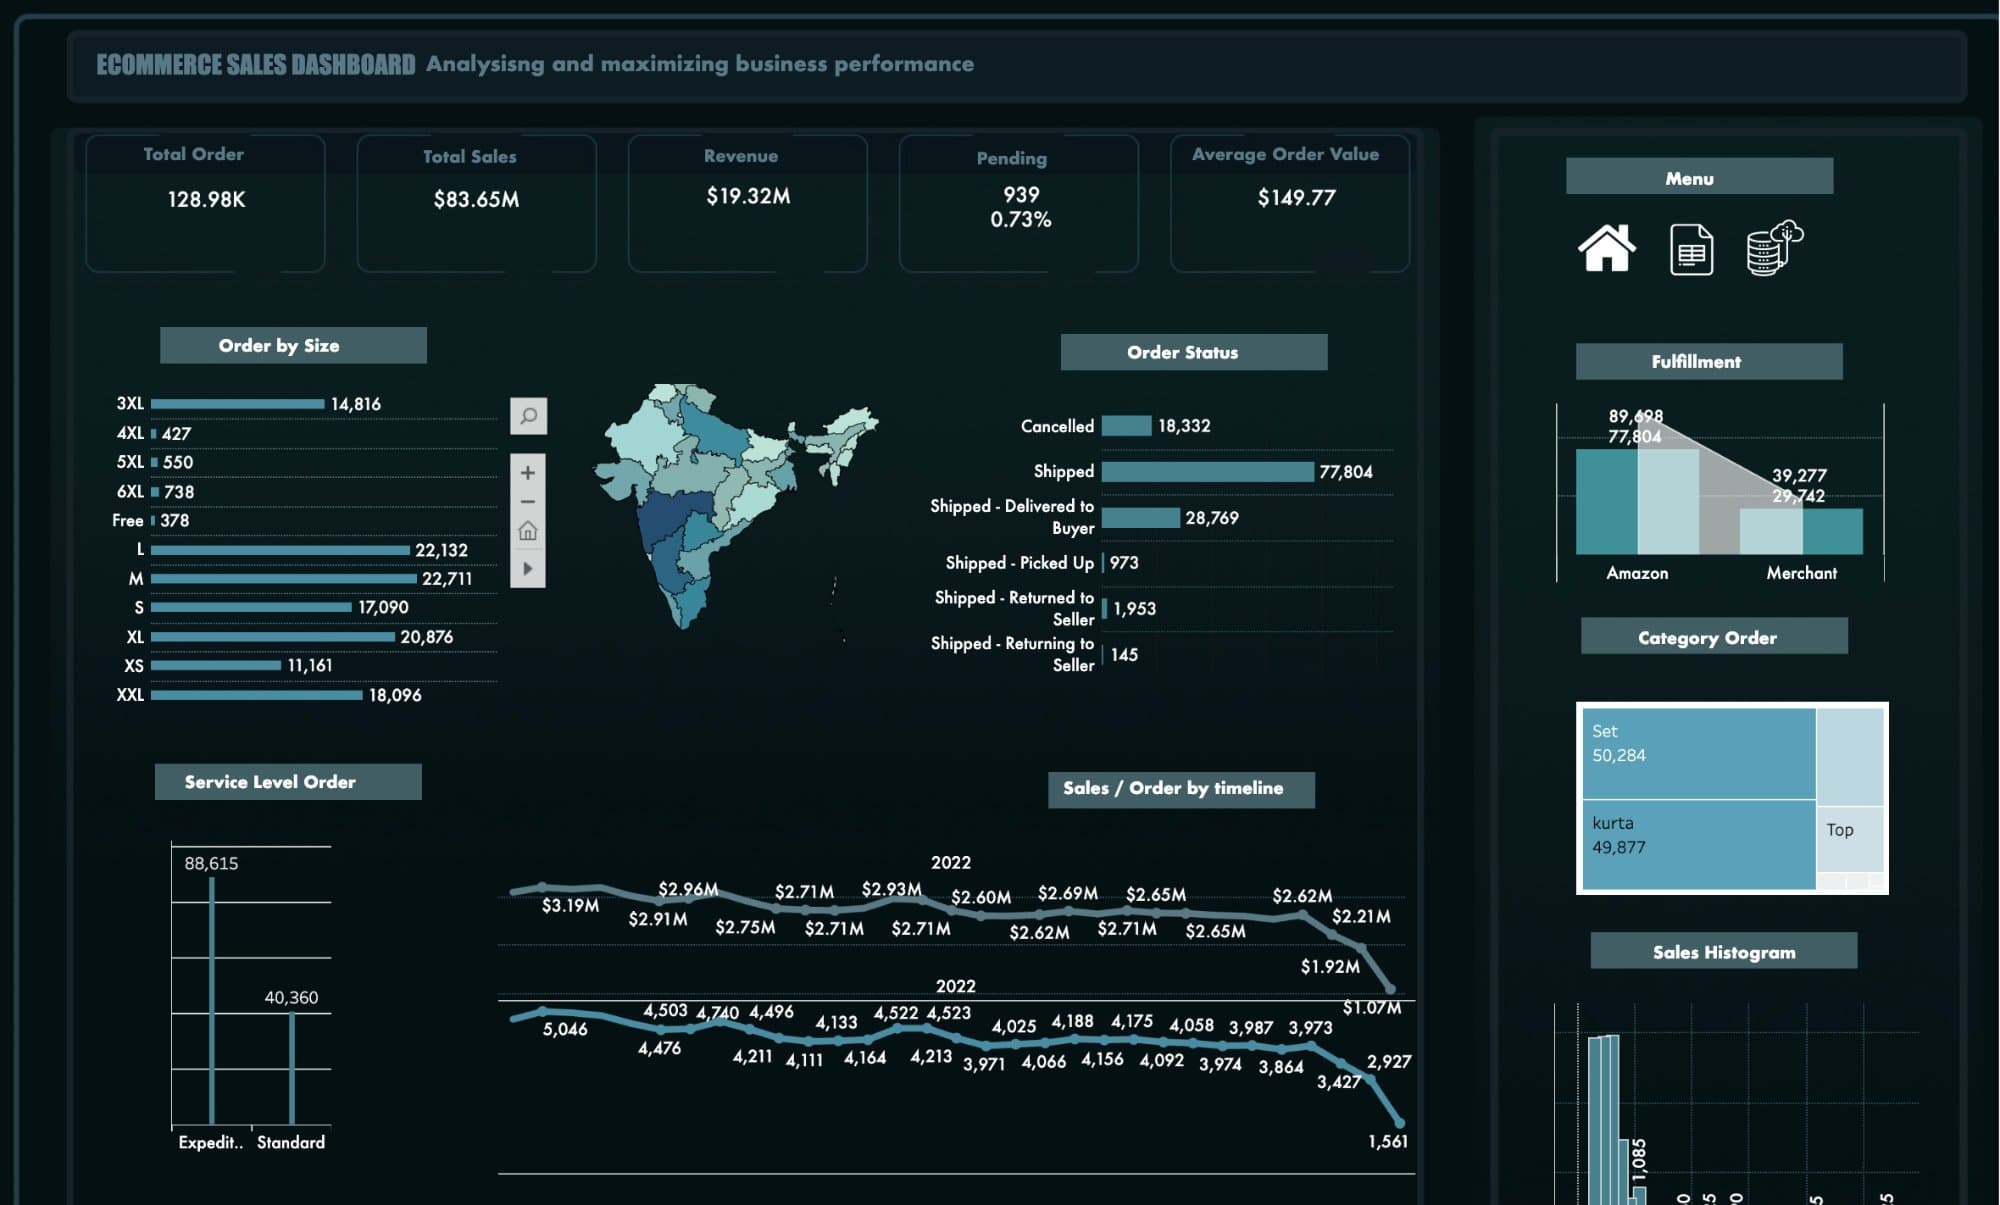
E‑commerce / Sales
An executive-style dark dashboard summarising order volume, sales and revenue, India choropleth performance, 2022 monthly trend, and Amazon vs merchant fulfillment split.
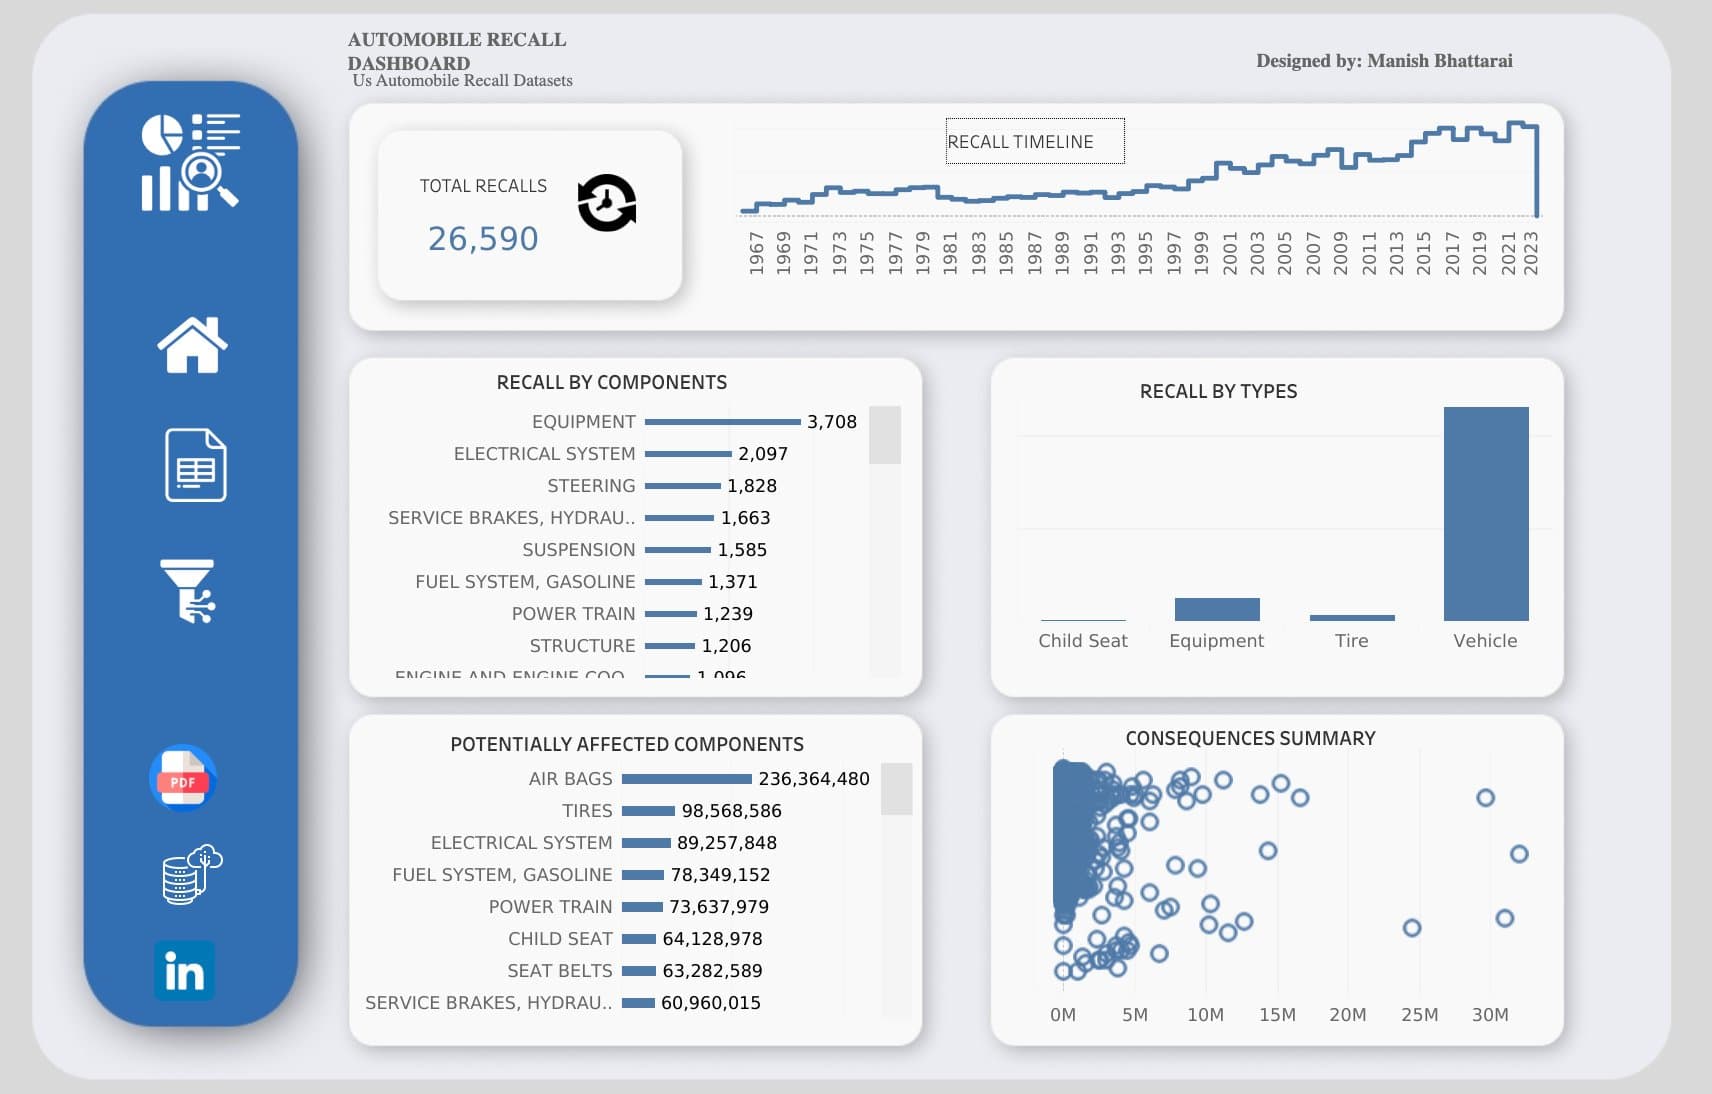
Automotive / Public safety
A Tableau safety dashboard covering tens of thousands of US vehicle recalls from 1967–2023, with breakdowns by component, recall type, consequence, and high-impact air-bag campaigns.
HR / People analytics
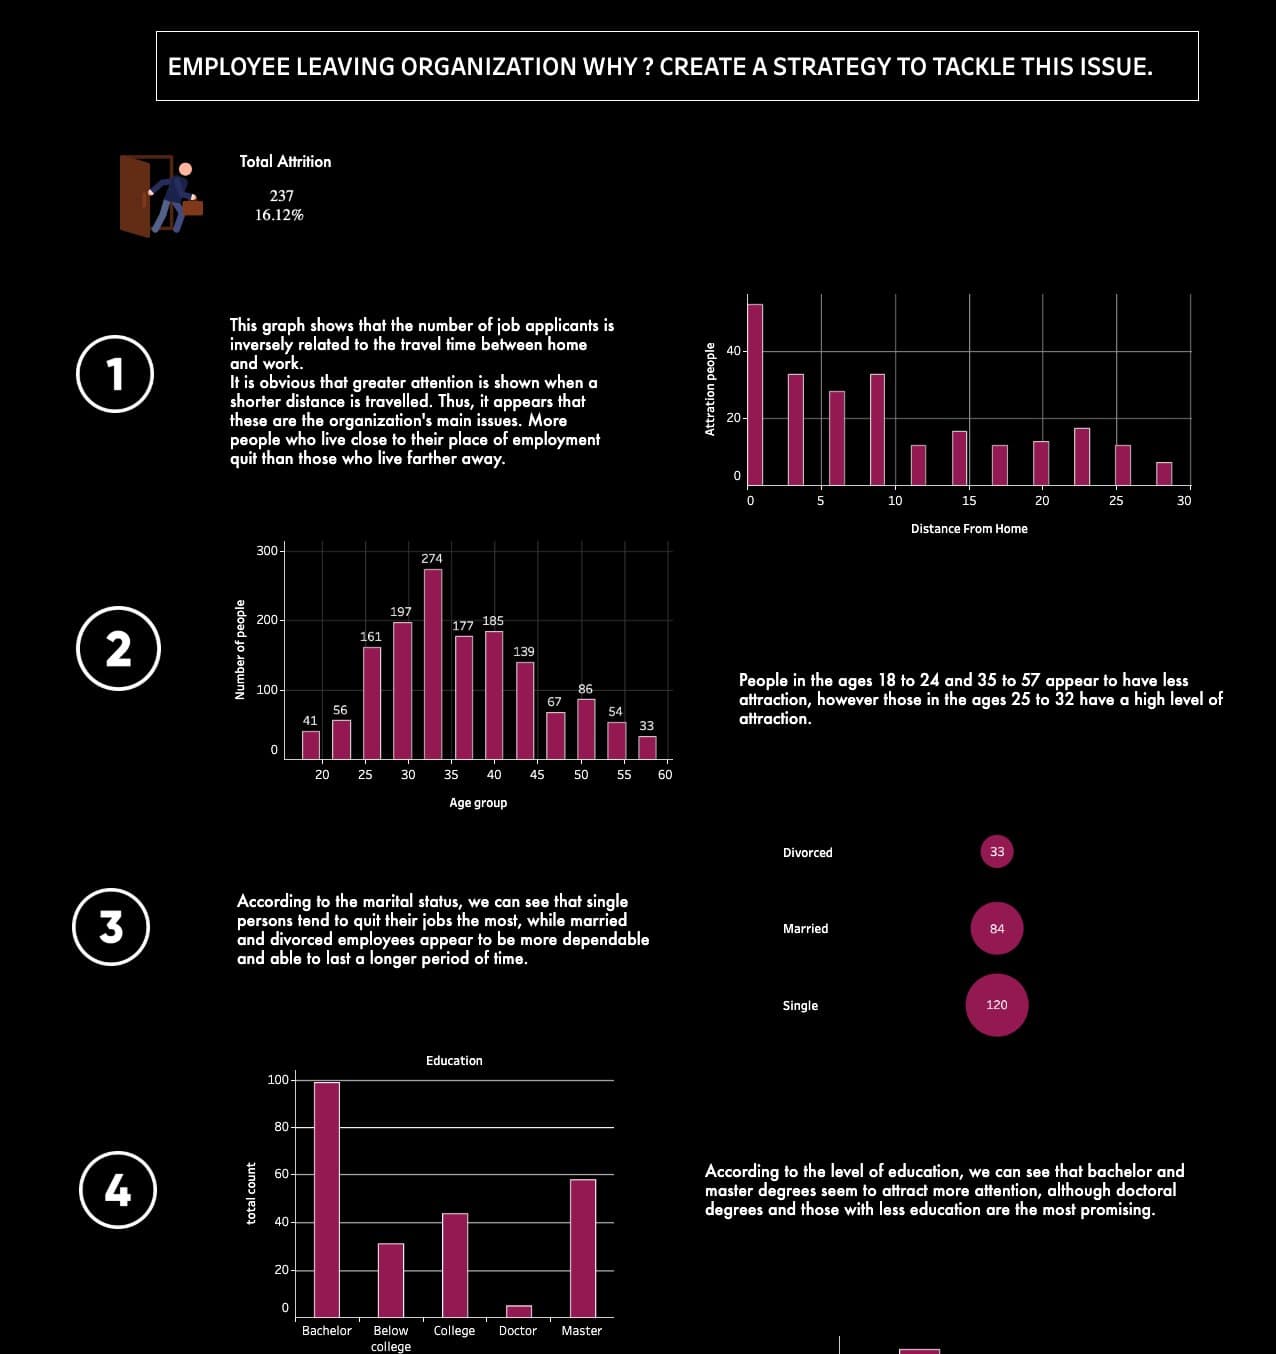
A four-panel Tableau story quantifying attrition count and rate, then breaking leavers down by commute distance, age bands, marital status, and education to inform retention programmes.
Labour markets / Tech
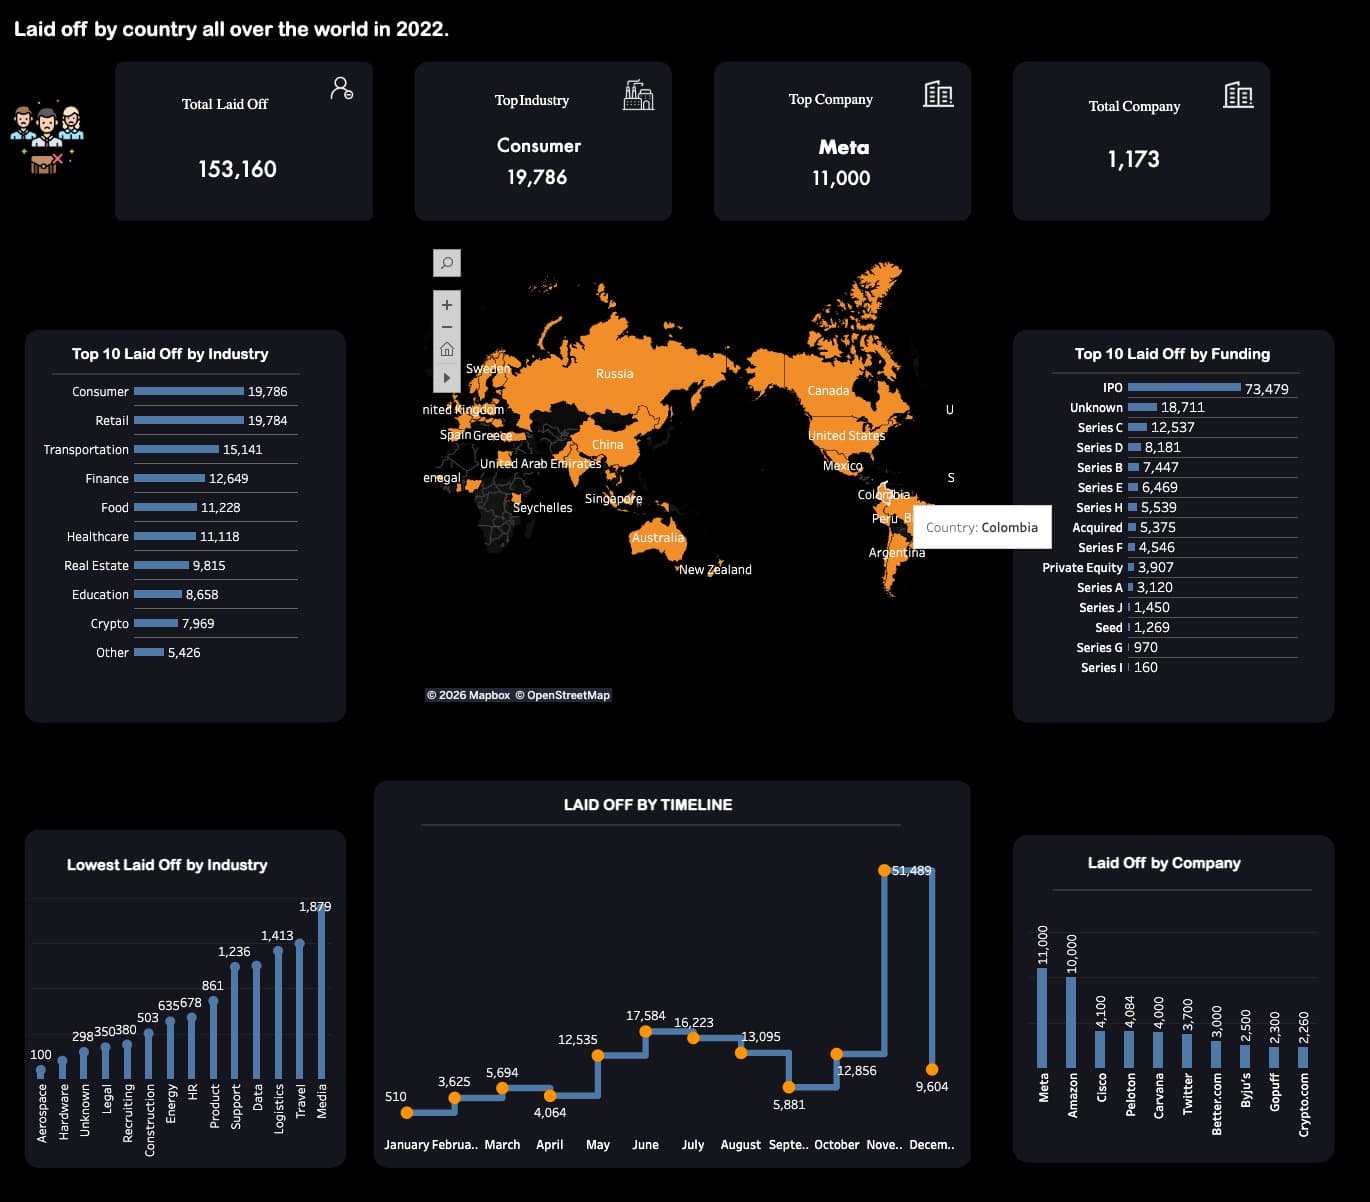
A Tableau global story on 2022 layoffs across more than a thousand companies—choropleth by country, monthly timeline (including a sharp November spike), and concentration among large tech employers.
Public health / Policy
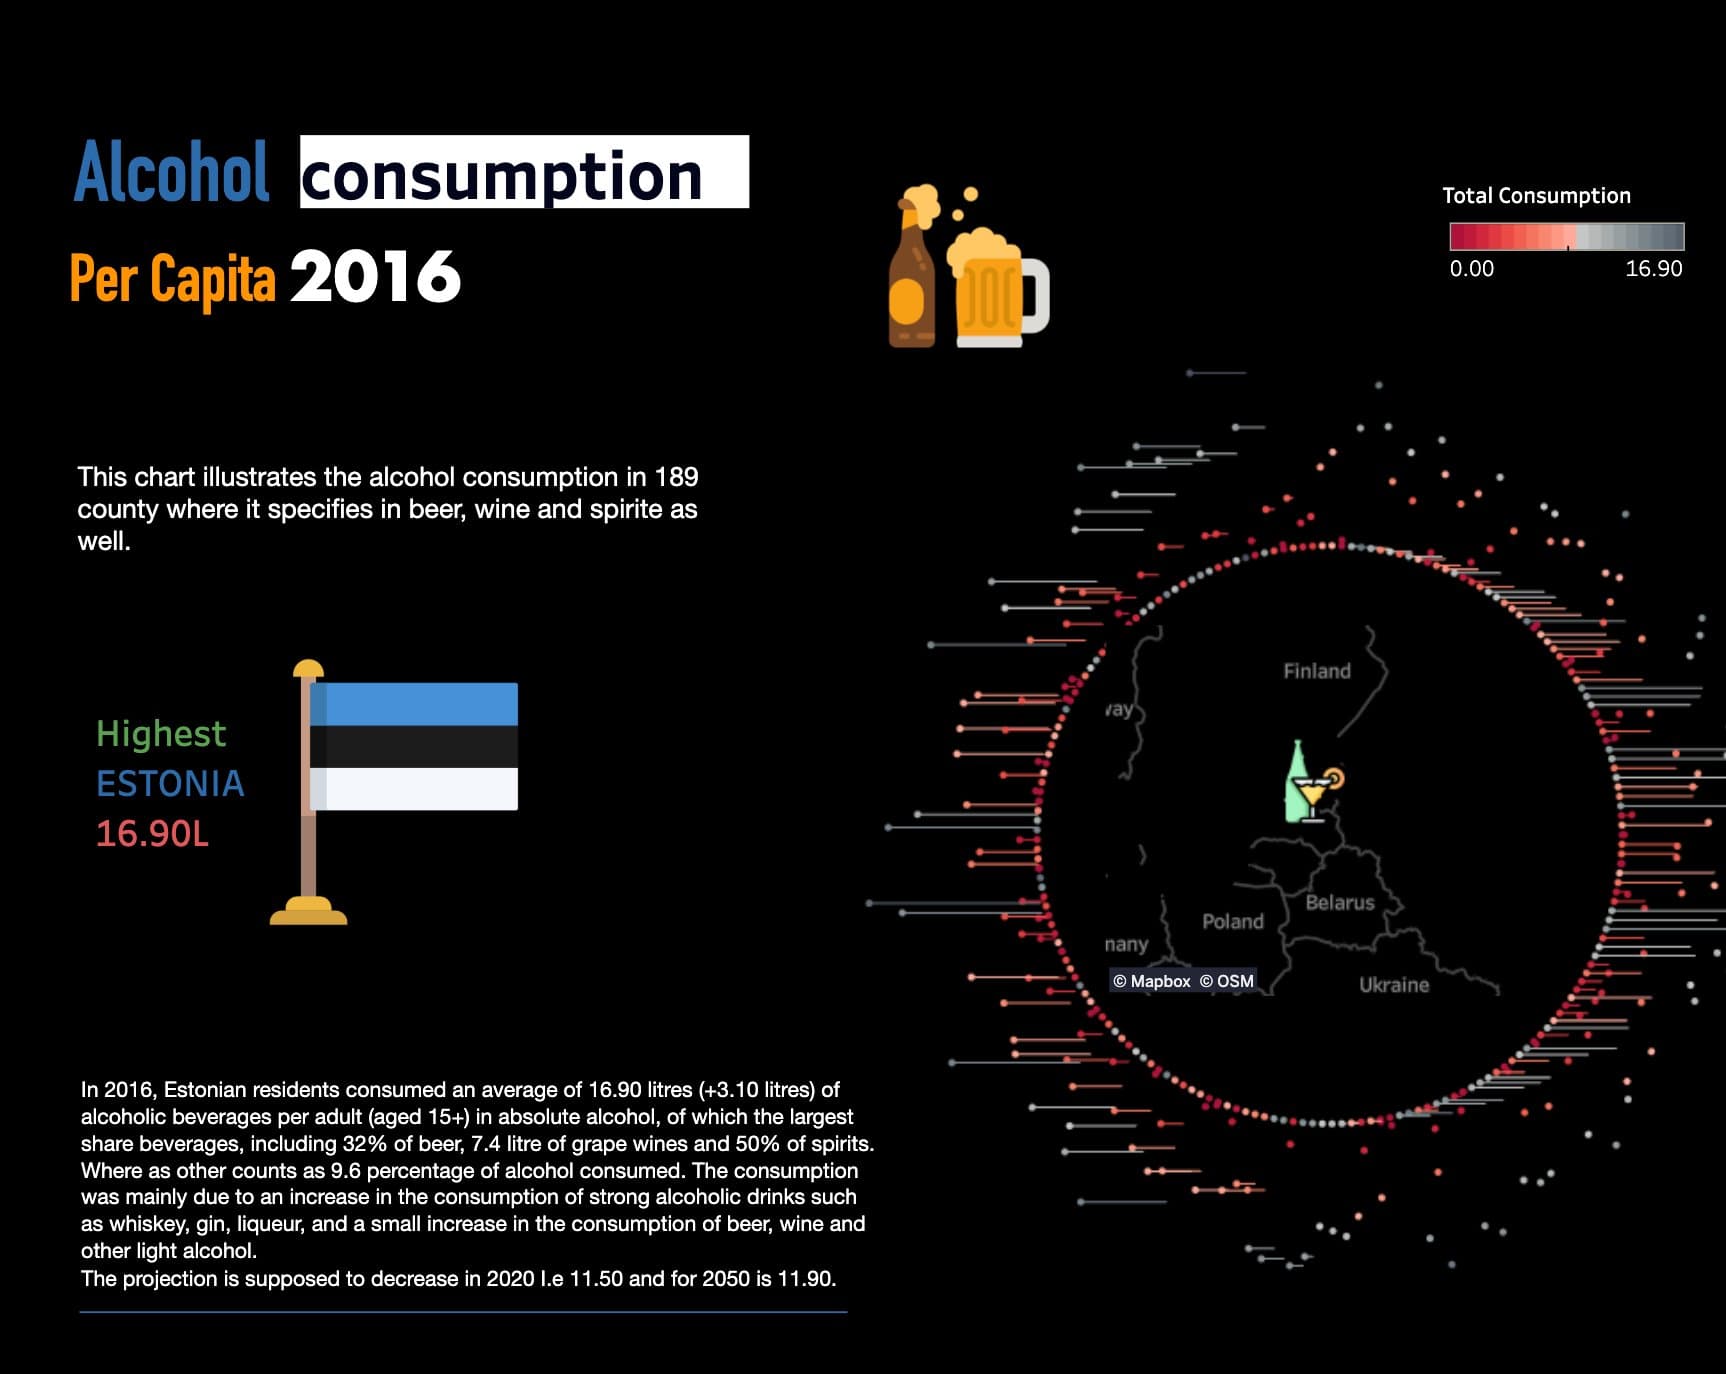
A radial Tableau visual comparing per-capita alcohol consumption worldwide, highlighting leaders such as Estonia (~16.9 L), with beer, wine, and spirits splits and discussion of forward-looking scenarios.
Why Evoqed for analytics
We combine statistical rigor with go-to-market context so your data program compounds instead of stalling after launch.
Impact
We design reporting around funnel economics and channel ROI—not vanity charts—so budget conversations stay grounded.
Clarity
Every deliverable explains what changed, why it matters, and what to try next. Leaders get clarity; operators get detail.
Trust
Definitions, access, and data quality checks are documented. Auditable methodology beats one-off spreadsheet magic.
Team
Senior analysts in your timezone—clear async updates and workshops when you need to align stakeholders fast.
Analytics investment

From $800
Typical delivery 1–2 weeks
Teams with data everywhere but no trusted single view—quick wins and a roadmap.
Includes
From $1.5k / mo
Monthly or quarterly cadence
Marketing and revenue leaders who want rhythm: reporting, commentary, and experiments.
Includes
Custom
Scope-based roadmap
Pipelines, warehouse modeling, embedded analytics, or predictive workflows.
Includes
Share your tools, reports today, and the decisions you need to make—we'll recommend an engagement shape within one business day.
Client stories
“Evoqed connected our Stripe, HubSpot, and product DB into a single dashboard in under two weeks. We finally know our real LTV and churn rate — it's changed every strategic decision we make.”
James M.
Co-founder, FinTech SaaS · Sydney
“We had data everywhere and insights nowhere. The Evoqed team built a churn prediction model that's already saved us 3 enterprise accounts. ROI was obvious from month one.”
Sarah P.
Head of Product · B2B Platform · Melbourne
“The free audit alone was worth it — they spotted three data issues we had no idea about. Then built the full pipeline in a month. Genuinely impressed by the speed and quality.”
Rahul K.
CTO · E-commerce Startup · Brisbane